International Journal of Agriculture, Environment and Biotechnology
Citation: IJAEB: 12(4): 311-318, December 2019
DOI: 10.30954/0974-1712.12.2019.3
©2019 IJAEB All rights reserved
AGRICULTURAL ENGINEERING
Groundwater Potential Zoning in Tikamgarh District of Bundelkhand Using Remote Sensing and GIS
Deepak Patle* and M.K. Awasthi
Department of Soil and Water Engineering, College of Agricultural Engineering, JNKVV, Jabalpur, Madhya Pradesh, India
*Corresponding author: deepak.patle12@gmail.com (ORCID ID: 0000-0001-9763-6168)
Paper No. 798
Received: 11-07-2019
Revised: 03-10-2019
Accepted: 23-11-2019
ABSTRACT
This study was conducted in Tikamgarh district of Bundelkhand, Madhya Pradesh, India to spatially delineate the groundwater potential zones using the integrated RS-GIS and MIF techniques. To do so, eight major biophysical and environmental factors like drainage density, geomorphology, geology, lineament density, land use/land cover, rainfall, slope and soil were considered. All the factors and their features have been assigned weights according to their relative importance and their normalized weights were calculated using the multi influence factor technique. Groundwater potential zoning map has been prepared through weighted overlay model in GIS environment after integrating all the thematic layers. The entire district has been classified into five different groundwater potential zones –Very Good, Good, Moderate, Poor and Very Poor depending on the likelihood of availability of ground water. Greater portion of the study area (40.60%) fall within the poor potentiality zone. About 3.10% and 11.54% of the total area fall under the very good and good potential zone respectively. 38.60% of the total area comes under the moderately potentiality zone. Only 6.16% of the total area fall under the very low potential zone. It shows that the applied technique produces considerably reliable results for this study which may facilitate the decision makers to formulate an effective plan for the study area.
Highlights
 This study conducted in Tikamgarh district of Bundelkhand, Madhya Pradesh, India to spatially delineate the groundwater prospect zones through RS-GIS approach.
Tikamgarh district is under comes drought prone zone of Bundelkhand region, so need have explore the ground water status.
In this study, we employed maximum eight groundwater influence factor for developing the ground water potential zones.
Keywords: Groundwater Potential Zones, MIF Technique, Weighted Overlay Method, Bundelkhand
Groundwater is most valuable and precious natural resource, which is more suitable and continuously available than other sources. Groundwater is replenishable, less contaminated and can be easily extracted. Records shows that 80% of rural population and 50% of urban population use groundwater for domestic purposes. This rate may increase further in future. But nowadays due to drastic changes in climatic conditions and dynamic development on land surface features there are fluctuations in water levels and shift in ground water zones. Hence there is a rise demand for identification and assessing the groundwater potential zones.
The issue of unsustainable groundwater utilization is turning into increasingly an apparent problem and therefore the key concern for several developing countries. One among the issues is that the absence of updated spatial info on the quantity and distribution of groundwater resource. Groundwater evaluation has been usually conducted using field survey which is not feasible in terms of time and resource (Aathira et al. 2018)
Researches shows that remote sensing and GIS has opened new path in Groundwater studies. Remote sensing is the technology of acquiring information about the Earth’s surface without in reality being in contact with it. Geographic Information System (GIS) is a computer based information system designed to accept large volumes of spatial data derived from variety of sources and to efficiently store, retrieve, analyze, model and display (output) these data according to user defined specifications. In recent studies researchers such as (Sumit das et al. 2018; Shivaji Govind Patel 2014; Chaudhary et al. 2017; Yasanthkumar et al. 2017; Magesh 2011) used Remote sensing and GIS for delineation of groundwater potential zones. Some researchers like Raju thapa et al. (2017), Lazarus and Yadav (2014), Ramu et al. (2010) has also checked the accuracy of the results through field verification. Hence all these results proved that remote sensing combined with GIS is a very efficient tool for identification of groundwater potential of any region with accurate results.
Delineation of groundwater potential zones through proper modeling approach is essential to handle the water scarcity problem of drought-prone region. Very few studies have been done over Tikamgarh district regarding the water issues. The objective of this study is to identify the groundwater potential zones of Tikamgarh district of Bundelkhand through RS-GIS and MIF techniques.
MATERIALS AND METHODS
Study Area
Tikamgarh district is positioned in the Northern part of Madhya Pradesh on the Bundelkhand Plateau between Jamuni, (a tributary of Betwa) and Dhasan River. It extends between 24°26’ and 25°34’ N latitudes and 78°26’ and 79°21’ E longitudes. The maximum length of the district is about 119 km from North to South and width is about 80 km. Thus, the total geographical extension of the district is 5048 sq. km. The major part of the study area is comprised of granite rocks and soils are classified as black humus granitic and yellowish grey colour with kankar soils. The whole district comes under the Betwa sub basin of Ganga basin. The groundwater in the area generally occurs under water table conditions. The normal annual rainfall of the Tikamgarh district is 1057.1 mm.
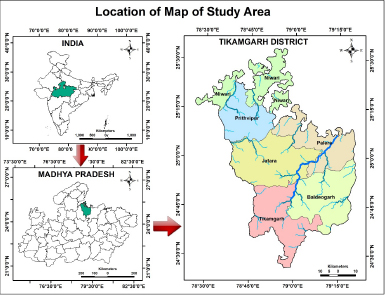
Fig. 1: Location of Study Area
Data Collection
Toposheets of Tikamgarh district has been collected from Survey of India, Madhya Pradesh on a scale of 1:50000. Geology, Geomorphology, and Lineament Density maps were obtained from Geological Survey of India, Madhya Pradesh. Digital Elevation Model (DEM) was downloaded from BHUVAN (Indian Geo-platform of ISRO). Drainage, Drainage Density and Slope maps were obtained from Digital Elevation Model (DEM) map. For Land Use/Land Cover (LULC) map, Satellite images from IRS-P6 LISS-III sensor, on a scale of 1:50,000 (geo-coded, with UTM projection, spheroid and datum WGS 84, Zone 44 North) collected from USGS Earth Explorer portal. Soil map was got from the Soil data collected from the National Bureau of Soil Survey and Land Use planning (NBSS&LUP), Nagpur. Average monsoon rainfall data of past 20 years was collected from Water Resource Department of Madhya Pradesh.
Stages of work
Integrated RS and GIS based approach is a powerful tool for assessing groundwater potential zones based on which suitable locations for ground water withdrawals could be identified. Methodology for preparing ground water potential zones map in the study area is presented. It involves in the following steps:
♦The first stage includes base map and various thematic maps preparation. Drainage map, Drainage Density map and Slope map were prepared by analysing the Cartosat-1 Digital Elevation Model (CartoDEM) Version 3 R1 with 30 m spatial resolution. Geology, Geomorphology, Lineament Density map and Soil maps were geo-referenced and digitized using ArcGIS 10.3. Land use/ land cover (LULC) map for year 2018, was prepared by digitization technique of satellite image and other ancillary data. The collected average monsoon rainfall data of 6 stations of past 20 years had information about the particular rain gauge station so the method Inverse Distance Weightage (IDW) in ArcGIS 10.3 was used to find out overall rainfall variation in the study area.
♦The collected data which was initially not in projected format was projected using project (data management) tool in ArcGIS 10.3 version. Also the data collected were in vector format, which is converted to raster using this tool. Polygon to raster (spatial analyst)’ conversion tool is used for converting polygon feature to raster data. ‘Line- density (3D analyst)’ conversion tool is used for converting line feature to raster data. All raster data sets were reclassified and exported with same cell size.
♦All the thematic layers have been assigned weightages and ranks depending upon their influence on groundwater bearing capacity by using MIF (Multi Influence Facter) technique.
Assigning weightage using MIF technique
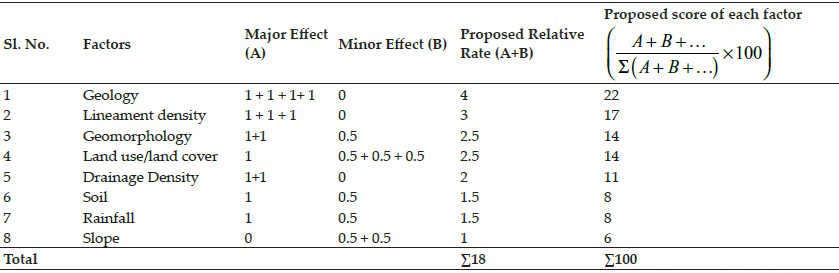
The effect of various parameters like geology, geomorphology, slope, lineament density, land use/land cover, drainage density, rainfall and soil type (depth or texture) on ground water potential zones were examined and assigned appropriate weightage to each parameter. Assigned a weightage of 1 for major interrelationship between two factors and 0.5 for minor interrelationship between two factors. The cumulative weightage of each factor were calculated and used for the calculation of relative rates. The suggested score for each influencing factor is calculated using the formula,
Where ‘A’ is the major influencing factor and ‘B’ is the minor influencing factor between two parameters. Table 1 shows the effect of influence factors, relative rates and score for each potential factor.
Fig. 2: Schematic diagram showing multi influence factors for groundwater potential zones
♦The parameters which influence the ground water potential zone are integrated in ‘weighted overlay analysis (spatial analyst)’ tool in ArcGIS 10.3 and finally Ground water potential map was prepared.
♦The composite map generated was further classified according to the spatial variation of the groundwater potential. Five categories of groundwater potential zones namely Very Good, Good, Moderate, Poor and Very Poor were identified and delineated.
Table 1: Influencing factors, their major-minor effects and corresponding scores
RESULTS AND DISCUSSION
Evaluation of factors governing groundwater potential zones
Geology
Geology is one of the major factor which plays an important role in the distribution and occurrence of groundwater. Geology consists of both porosity and permeability in aquifer rocks. The rock type exposed at the surface significantly affects the ground water recharge (Yeh 2016). Entire Tikamgarh district falls in Bundelkhand granite and gneisses, which are profusely intruded by quartz reefs and pegmatites. Granite is generally flesh-red colour and coarse grained showing porphyritic texture. These quartz reefs act as water divides as well as cut off walls across the ground water flows. Ranks are assigned according to its water holding capacity. Fig. 3 shows the geology map of the study area.
Geomorphology
Geomorphology is the study of earth structures and landforms. It is mainly depend on structural evolution of geological formation (Waikar & Nilawar 2014). The study area is covered by various types of geomorphological features such as Denudational hills, pediment, undulating upland, Pediment Inselberg complex and pediplain. The Denudational hill features is classified into five categories. (1) Denudational hill with high surface runoff and high topography (2) Denudational hills with moderate slope (3) Dykes (4) Water bodies: water bodies are lakes, ponds, streams (5) flood plains (Manap, Sulaiman, Ramli, Pradhan, & Surip, 2013). Tikamgarh district is mostly covered by Pediment and Pediplain complex. Fig. 4 shows the geomorphology of the study area.
Lineament density
Lineaments are structurally controlled linear or curvilinear features which are identified from satellite imagery by their relatively linear alignments. Lineaments represent zones of faulting and fracturing resulting in increased permeability. They are hydro-geologically very important since they act as path ways for ground water movement. Lineament density (km/sq. km) of an area can directly reveal the ground water potential since the presence of lineaments usually denotes permeable zone. Area with high lineament density are good for ground water potential zones. Fig. 5 shows the lineament density map of the study area.
Land use/land cover
Land use land cover is one of the main parameters which influence the occurrence and development of groundwater. Land use refers to man’s activities in land, various uses which are carried out on land, etc. Land cover denotes the natural vegetation, water bodies, rocks etc that resulted due to land transformation. LU/LC affects evapotranspiration volume, timing and recharge of ground water system. It is observed that spatial variation in the amount of groundwater storage occurs due to changes in land use and vegetation cover, hence proper understanding of LU/LC is necessary to estimate the water resources, and it has therefore been included in this study. Identified features from the study area are built up land, paddy area, rocky area, mixed crop, forest, agricultural fallow land and water body. Forest and agricultural ecosystem together occupy major portion of the study area.
Figure 6 depicts the land use pattern of the study area. LU/LC map shows that about 75.60% area of Tikamgarh district comes under the agricultural land category. Forest covers an area of 12.60%. Built- up land covers about an area of 3.30%. Water bodies an area of 2.20%, Open/Barren land covers an area of 5.1% and waste land covers an area of 1.20%.
Drainage Density
Drainage and drainage density are major factors which affect the ground water occurrence in the area. Drainage density is defined as the closeness of spacing of stream channels. It is the measure of total length of stream segment of all orders per unit area. Drainage density is an inverse function of permeability. It is notable that the high drainage density areas have less recharge rate, whereas the low drainage density areas have a high recharge rate (Rajaveni et al. 2015). Slope affects the drainage density and it produces differences from place to place. According to drainage density, study area is divided into 5 classes: very low, low, medium, high and very high.
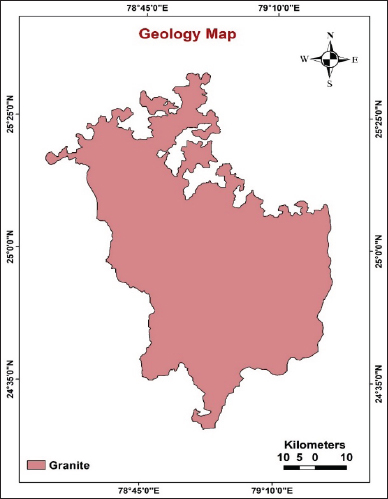
Fig. 3: Geology map of the Tikamgarh district of Budelkhand
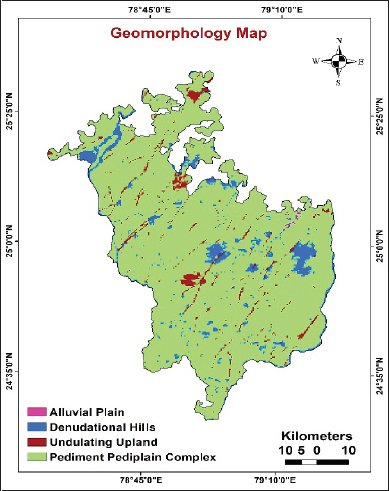
Fig. 4: Geomorphlogy map of the Tikamgarh district of Budelkhand
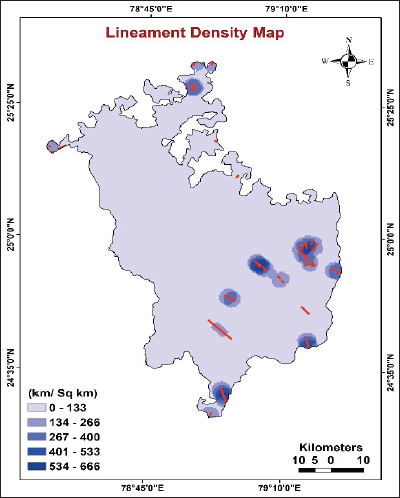
Fig. 5: Lineament Density map of the Tikamgarh district of Budelkhand
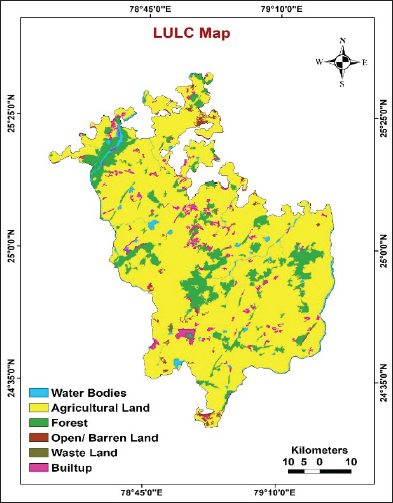
Fig. 6: Land Use Land/ Cover map of the Tikamgarh district of Budelkhand
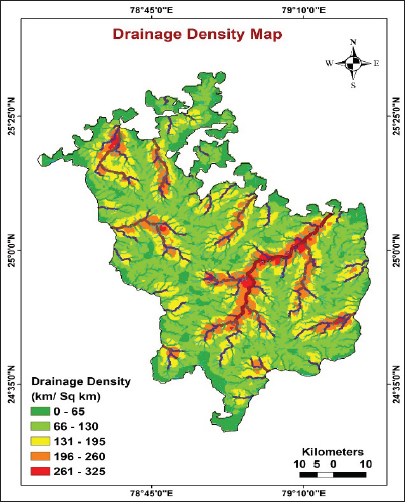
Fig. 7: Drainage Density map of the Tikamgarh district of Budelkhand
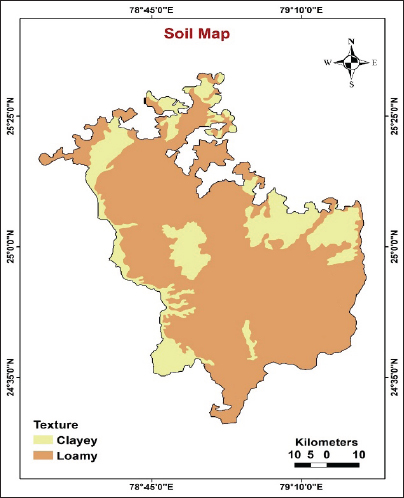
Fig. 8: Soil map of the Tikamgarh district of Budelkhand
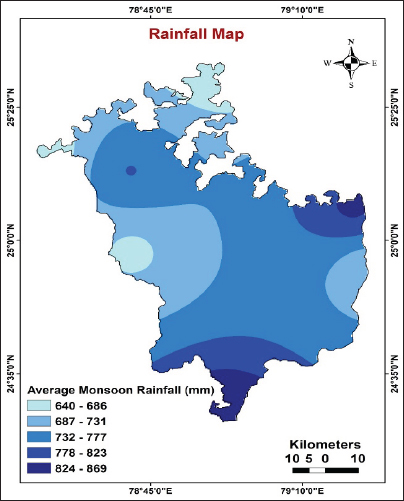
Fig. 9: Rainfall map of the Tikamgarh district of Budelkhand
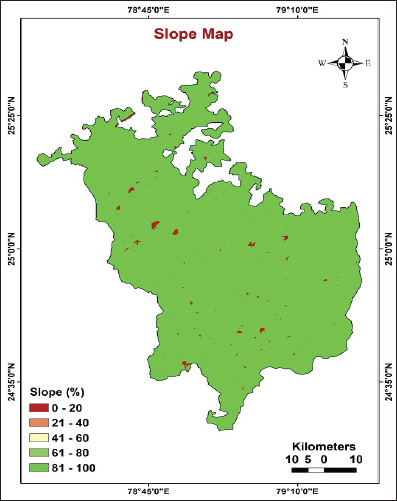
Fig. 10: Slope map of the Tikamgarh district of Budelkhand
Soil
In Tikamgarh district, Soils derived from parent rocks are of two types i.e. black humus granitic and yellowish grey colour with kankar soils. Soil characteristics have a considerable role on the infiltration of water. Infiltration capacity heavily depends on the soil texture. Porosity and permeability are directly influenced by texture. Infiltration capacity of the fine-grained soil is low compared to coarse-grained soil because of porosity and permeability. Soil cover is very thin in this study area and it is composed of sandy and reddish materials which are derived from the weathering of granite and gneiss. Various types of soil texture are present in the different parts of the district. Clayey soil covers 1144.89 km2 (22.68%) and loamy soil constitutes about 3903.11 km2 (77.32%).
Rainfall
Atotal of 80–85% of total rainfall happens during the July–September period, south-west monsoon is the main source of rainfall. Tikamgarh district often suffers drought condition due to shortage of rainfall. In a hard rock area, rainfall is the main source of groundwater recharge in which the water infiltrates into subsurface through fractures and soils (Thapa et al. 2017). The data was procured from the Indian Meteorological Department (IMD) and the map was generated using Inverse distance (IDW) method in ArcGIS 10.3 environment. The average monsoon rainfall found ranges between 640 to 869 mm in last 20 years over the study area.
Slope
Slope is the rate of change of elevation and it is considered as the principal factor of the superficial water flow since it determines the gravity effect on the water movement. Slope is directly proportional to run-off. In steep slopes ground water recharge will be less. The water flow over the gently undulating plains is slow and adequate time is available to enhance the infiltration to the underlying fractured aquifer. The slope was estimated from the Digital Elevation Model (DEM). Fig. 10 shows the slope map of the study area.
Groundwater potential zones
The resulted groundwater potential zones map through MIF technique and weighted overlay method divided the study area into five classes, viz., very poor, poor, moderate, good and very good zones contributing to 310.95 km2 (6.16%), 2049.49 km2 (40.60%), 1948.53 km2 (38.60%), 582.54 km2 (11.54%) and 156.49 km2 (3.10%), (Fig. 11). For validation the trustworthiness of final result, well inventory survey may be conducted on various locations of the study area.
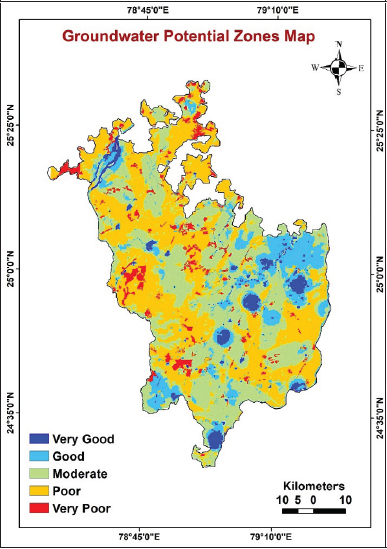
Fig. 11: Groundwater Potential Zone map of the Tikamgarh district of Budelkhand
CONCLUSION
In the present study, the combined use of Remote Sensing and GIS with MIF technique is proved to be a powerful tool for the delineation of groundwater potential zones in Tikamgarh district of Bundelkhand. The final map matches with the ground truth data indicates the validity of the model. The integration of geology, geomorphology, drainage density, lineament density, soil, slope, rainfall and LU/LC gives prior information to planner and decision makers involved in the preparation of water resources development plans, so as to prepare economically viable plans. The present study concludes, most of the study area falls under poor to moderate groundwater potential zones. The groundwater potential map of Tikamgarh district shows that only 156.49 and 568.54 km2 areas falls under very good and good category of groundwater availability whereas 1948.53 km2 area falls under moderate category, 2049.49 and 310.95 km2 area comes under poor and very poor category of groundwater availability. The farmers in the area will be highly benefited from such type of studies for further targeting sites under various zones for exploration of groundwater.
REFERENCES
Aathira, S., Varma, D., Gayathry, T.J., Nimisha, K.J. and Ann, J.A. 2018. Identification of Ground Water Potential Zones Using GIS and Remote Sensing. International Journal of Current Engineering and Scientific Research, 5(4): 50-63.
Adithyan, D., Justin, J., Rose, M.M., Thushara, J. and Geeja, K.G. 2019. Identification of Groundwater Potential Zones at AMPRS, Odakkali using Remote Sensing and GIS. International Research Journal of Engineering and Technology, 6(4): 3295-3303.
Chaudary, B.S. and Kumar Sanjeev. 2018. Identification of ground water potential zone watershed by using remote sensing and GIS of Koshalya-Jhajhara watershed, India. Journal Geological Society of India, 91(1): 717-721.
Das, S. and Pardeshi, S.D. 2018. Integration of different influencing factors in GIS to delineate groundwater potential areas using IF and FR techniques: a study of Pravara basin, Maharashtra, India. Applied Water Science,8(7): 197.
Debu Mukherjee. 2016. Review on artificial ground water recharge in India, SSRG-IJCE., 3(1).
Etikala, B., Golla, V., Li, P. and Renati, S. 2019. Deciphering groundwater potential zones using MIF technique and GIS: A study from Tirupati area, Chittoor District, Andhra Pradesh, India. Hydro Research, 1: 1-7.
Lazarus, G., Ndatuwong et al., Yadav, G.S. 2014. Integration of hydrogeological factors for Identification of Groundwater Potential Zones using Remote sensing and GIS technique. Journal of Geosciences and Geomatics, 2(1): 11-16.
Manap, M.A., Sulaiman, W.N.A., Ramli, M.F., Pradhan, B. and Surip, N. 2013. A knowledge-driven GIS modeling technique for groundwater potential mapping at the Upper Langat Basin, Malaysia. Arabian Journal of Geosciences, 6(5): 1621-1637.
Magesh, N.S., Chandrasekarn and John, P.S. 2012. Delineation of ground water potential zones in Theni district, Tamilnadu, using remote sensing and GIS and MIF techiques. Geoscience Frontiers, pp. 189-196.
Rajaveni, S.P., Brindha, K. and Elango, L. 2015. Geological and geomorphological controls on groundwater occurrence in a hard rock region. Applied Water Sci., 7(3): 1377–1389.
Ramu, M.B. and Vinay, M. 2014. Identification of ground water potential zones using GIS and Remote Sensing Techniques: A case study of Mysore taluk-Karnataka. Int. J. Geomatics. Geosci., 5: 393-403.
Shivaji, G.P. and Nitin Mahadeomohite. 2014. International Journal of Geomatics and Geo Science, 4(3).
Thapa, R., Gupta, S. and Kaur, H. 2017. Delineation of potential fluoride contamination zones in Birbhum, West Bengal, India, using remote sensing and GIS techniques. Arabian Journal of Geosciences, 10(23): 527.
Waikar, M.L., Aditya, P. and Nilawar. 2014. Identification of ground water potential zone using remote sensing and GIS technique, 3(5).
Yaswanth, Y.K., Satyanarayana Mooorthy, D.V. and Shanmukasrinivas, G. 2017. Identification of ground water potential zones using remote sensing and Geographical information system. IJCIRT., 8(3).
Yeh, H.F., Chengn, Y.S., Lin, H.I. and Lee, C.H. 2016. Mapping groundwater recharge potential zone using a GIS approach in Hualian River, Taiwan. Sustainable Environment Research, 26(1): 33-43.